 |
|
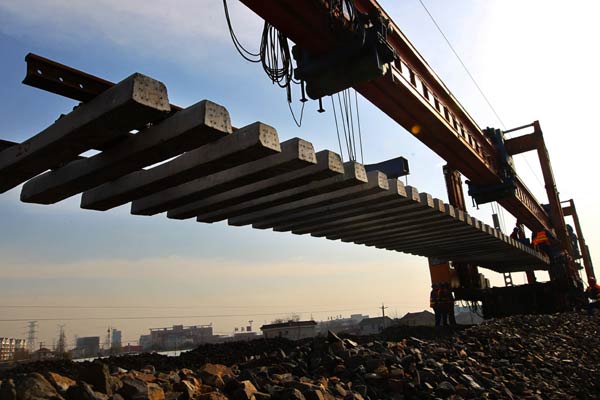
Rail tracks are laid on a route in Nantong, Jiangsu province. [Photo/China Daily] |
In recent years, the relationship between China's economic growth and two key indicators - power consumption and freight volume - has attracted extensive attention both at home and abroad. In the "new normal", elasticity coefficient between economic growth and the two indicators is undergoing some changes, where the discrepancy, to some extent, reflects the progress made in industrial restructuring and upgrade. However, their orientation significance and logical relations, as well as rules and effectiveness, tend to remain unchanged.
Changes consistent with economic growth in general
Power consumption growth is basically synchronized with economic growth. From 1998 to 2007, China's year-on-year GDP growth rate increased from 7.8 percent to 14.2 percent, while the overall power consumption also took on a growing trend. In 2008, due to the international financial crisis, the country's economic growth rate dropped sharply, so did the growth of power use. Backed by massive stimulus policies, economic growth picked up from 2009 to 2010, when the power consumption also grew faster. From 2011 to 2015, both economic growth and power consumption slowed. Econometric analysis shows the correlation coefficient between total power consumption and GDP growth stood at 0.741 during 1998-2014, and that between industrial power use and industrial value-add growth hit 0.898.
Freight transportation moves similarly to economic growth. From 1998 to 2007 when China's economy experienced a sustained rapid development, the railway freight volume grew from the bottom point of 1988 and kept increasing rapidly despite some fluctuations. From 2008 to 2009, due to economic slowdown, the freight volume growth rate dropped significantly. From 2011 to 2015, economic growth and freight volume growth both fell. Econometric analysis shows the correlation coefficient between freight volume and GDP growth reached 0.646 during 1998-2014, and that between the freight volume and the industrial value-add growth reached 0.760.
Higher fluctuation conforms to economic laws
China's power consumption grows faster than GDP when the country's economy gains momentum, while drops more sharply amid economic slowdown. During 2000 and 2007, with the rapid economic development, the power consumption grew rapidly, with the elasticity coefficient of power consumption higher than 1. In 2008-2009, economic growth declined significantly, so the elasticity coefficient of power consumption dropped to 0.58 and 0.78 respectively.
The main reason is that power consumption varies from industry to industry. Electricity consumption per output unit in heavy industries is relatively higher, while in light industries is lower. Industrial power use, 70 percent by six major high-energy-consuming industries, accounts for more than 70 percent of that of the whole society. Generally speaking, when an economy recovers, heavy industries develop more rapidly, driving power consumption; when the economy slows, heavy industries grows more slowly leading to a sharper drop in power consumption. As a result, the fluctuation of power consumption is greater than that of the industrial output value.
Freight transportation in China, however, increases slower than GDP growth due to railway capacity restriction, but drops faster amid economic slowdown. When an economy picks up, surging commodities demand leads to rapid freight volume growth. When the economy slows down, demand for commodities and raw materials will be largely weakened, resulting in a sharp decrease of railway freight elasticity, even to a negative value. In 2009 when the global financial crisis stroke, the freight volume growth fell to 0.9 percent, with the elasticity coefficient being only 0.1; from 2010 to 2011, it increased rapidly alongside with the economic recovery; since 2012, it slows significantly or even decreased amid economic downturn.


Copyright 1995 - 2010 . All rights reserved. The content (including but not limited to text, photo, multimedia information, etc) published in this site belongs to China Daily Information Co (CDIC). Without written authorization from CDIC, such content shall not be republished or used in any form. Note: Browsers with 1024*768 or higher resolution are suggested for this site.
License for publishing multimedia online 0108263 Registration Number: 20100000002731 ![]()